|
Вероятно, из-за массовых блокировок Telegram, ограничивается доступ к нашему сайту в зоне .RU Сохраните адрес полного аналога FinGet.ru для бесперебойного доступа к биржевой информации
| April New Home Sales |
 |
|
| Updated: 28-May-26 11:52 ET |
|
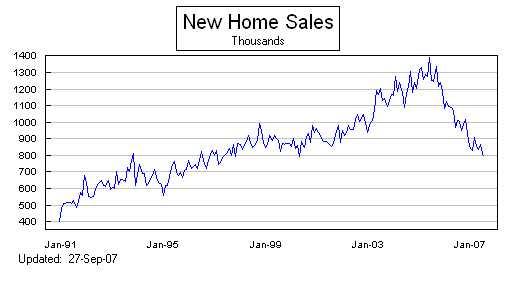
Highlights
- New home sales decreased 6.2% month-over-month in April to a seasonally adjusted annual rate of 622,000 from a revised 663,000 (from 682,000) in March.
- On a year-over-year basis, new home sales were down 11.3%.
Key Factors
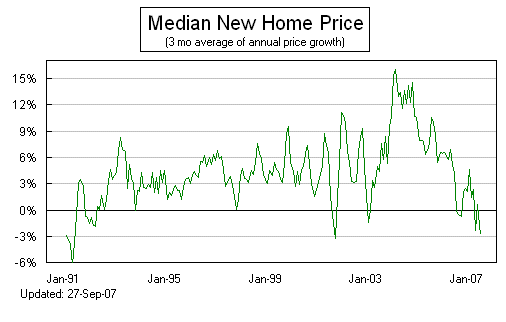
- The median sales price increased 2.2% yr/yr in April to $422,500, while the average sales price decreased 1.1% yr/yr to $508,800.
- New home sales month-over-month/year-over-year by region in April: Northeast (-12.9%/-12.9%); Midwest (-25.0%/-21.4%); South (-9.8%/-14.7%); and West (18.7%; 4.6%).
- At the current sales pace, the supply of new homes for sale stood at 9.4 months, versus 8.7 in March and 8.6 months in the year-ago period.
- The percentage of new homes sold for $399,000 or less accounted for 45% of new homes sold versus 52% in March. Homes priced between $400,000 and $799,000 accounted for 46% of new homes sold versus 38% in March. New homes priced at $800,000 or over accounted for 9% of sales versus 9% in March.
Big Picture
- The key takeaway from the report is that the median sales price increased even though the supply (9.4 months) of homes approached this year's high (9.9) from January.
| Category |
APR |
MAR |
FEB |
JAN |
DEC |
| Total Sales |
622K |
663K |
641K |
576K |
723K |
| Inventory (months) |
9.4 |
8.7 |
9.1 |
9.9 |
7.9 |
| Median Price Y/Y |
2.2% |
-5.3% |
-0.7% |
-3.1% |
1.4% |
|
|
|
|