|
Вероятно, из-за массовых блокировок Telegram, ограничивается доступ к нашему сайту в зоне .RU Сохраните адрес полного аналога FinGet.ru для бесперебойного доступа к биржевой информации
| April Personal Income and Spending |
 |
|
| Updated: 28-May-26 10:14 ET |
|
Highlights
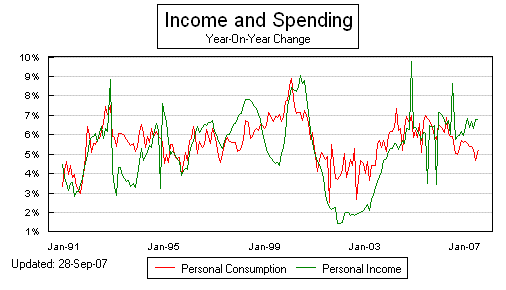
- Personal income for April decreased slightly, resulting in an unchanged month-over-month reading ( consensus 0.5%) after a revised 0.5% increase (from 0.6%) in March.
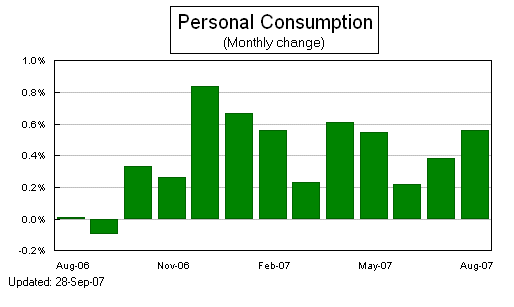
- Personal spending rose 0.5% month-over-month ( consensus 0.4%) following a revised 1.0% increase (from 0.9%) in March.
- The PCE Price Index increased 0.4% month-over-month ( consensus 0.5%), leaving it up 3.8% yr/yr versus 3.5% in March.
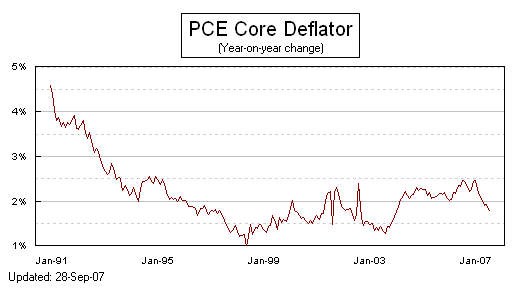
- The core PCE Price Index rose 0.2% ( consensus 0.3%), leaving it up 3.3% yr/yr versus 3.2% in March.
Key Factors
- The PCE Index for Goods was up 0.7% in April after increasing 1.4% in March. The index was up 1.2% year-over-year in April versus 1.0% in March.
- The PCE Price Index for Services was up 0.3% in April after increasing 0.3% in March. The index was up 2.5% year-over-year versus 2.6% in March.
- Wages and salaries increased 0.2% month-over-month in April after increasing 0.4% in March.
- Real disposable income decreased 0.5% month-over-month in April after decreasing 0.2% in March.
- Real personal spending was up 0.1% month-over-month after increasing 0.3% in March.
- The personal savings rate, as a percentage of disposable personal income, fell to 2.6% from 3.6% in March.
Big Picture
- The key takeaway from the report is that the lack of income growth combined with an acceleration in the year-over-year core PCE Price Index (to 3.3% from 3.2%) will invite stagflationary concerns, especially if this dynamic continues in the following months.
| Category |
APR |
MAR |
FEB |
DEC |
NOV |
| Personal Income |
|
|
|
|
|
| Total Income |
0.0% |
0.5% |
0.0% |
0.5% |
0.3% |
| Wage and Salary |
0.2% |
0.4% |
0.1% |
0.5% |
0.1% |
| Disposable Income |
-0.1% |
0.5% |
-0.1% |
1.0% |
0.3% |
| Savings Rate |
2.6% |
3.2% |
3.6% |
4.5% |
3.9% |
| Personal Consumption |
|
|
|
|
|
| Total (Nominal) |
0.5% |
1.0% |
0.7% |
0.4% |
0.4% |
| Total (Real, Chain $) |
0.1% |
0.3% |
0.3% |
0.0% |
0.1% |
| Core PCE Deflator |
|
|
|
|
|
| Month/Month |
0.2% |
0.3% |
0.4% |
0.4% |
0.3% |
| Year/Year |
3.3% |
3.2% |
3.0% |
3.1% |
2.8% |
|
|
|
|