|
Вероятно, из-за массовых блокировок Telegram, ограничивается доступ к нашему сайту в зоне .RU Сохраните адрес полного аналога FinGet.ru для бесперебойного доступа к биржевой информации
| May Nonfarm Payrolls |
 |
|
| Updated: 05-Jun-26 09:19 ET |
|


Highlights
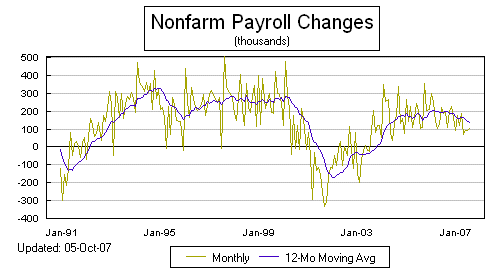
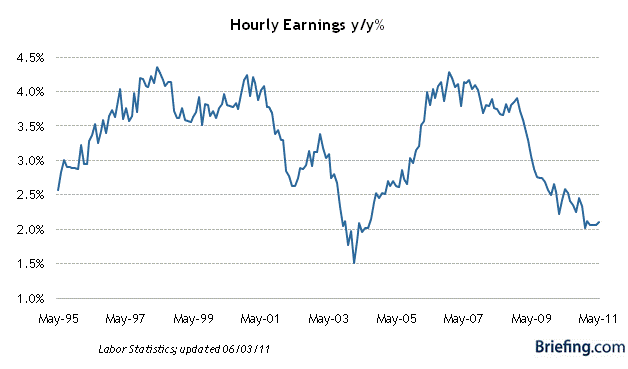
- Nonfarm payrolls surged by 172,000, aided by a 52,000 increase in government jobs; the unemployment rate held steady at 4.3%, along with the labor force participation rate (61.8%), and average hourly earnings increased 0.3% month-over-month.
Key Factors
- May nonfarm payrolls increased by 172,000 ( consensus: 96,000). The 3-month average for total nonfarm payrolls increased to 188,000 from 79,000. April nonfarm payrolls revised to 179,000 from 115,000. March nonfarm payrolls revised to 214,000 from 185,000.
- May private sector payrolls increased by 120,000 ( consensus: 89,000). April private sector payrolls revised to 177,000 from 123,000. March private sector payrolls revised to 202,000 from 190,000.
- May unemployment rate was 4.3% ( consensus: 4.3%) versus 4.3% in April. Persons unemployed for 27 weeks or more accounted for 27.5% of the unemployed versus 25.3% in April. The U6 unemployment rate, which accounts for unemployed and underemployed workers, decreased to 8.1% from 8.2% in April.
- May average hourly earnings were up 0.3% ( consensus: 0.3%) on the heels of a 0.2% increase in April. Over the last 12 months, average hourly earnings have risen 3.4% versus 3.6% for the 12 months ending in April.
- The average workweek in May was 34.3 hours ( consensus: 34.3) versus 34.3 hours in April. The manufacturing workweek was unchanged at 40.4 hours. Factory overtime edged up to 3.1 hours.
- The labor force participation rate held steady at 61.8%.
- The employment-population ratio increased to 59.2% from 59.1% in April.
Big Picture
- The key takeaway from the report is that it is manna for headline writers but still lacks some important sustenance to suggest it is a marker of an economy running on a full stomach. To wit: real average hourly earnings on a year-over-year basis are down 0.4%; there were job losses in the retail trade (-1,100), information (-2,000), and financial (-22,000) industries; and the percentage of unemployed workers for 27 weeks or more increased to 27.5% from 25.3%, which we will assume speaks to the difficulty of finding a new job with comparable compensation to the prior one.
| Category |
MAY |
APR |
MAR |
FEB |
JAN |
| Establishment Survey |
|
|
|
|
|
| Nonfarm Payrolls |
172K |
179K |
214K |
-156K |
160K |
| Goods-Producing |
28K |
14K |
33K |
-21K |
45K |
| Construction |
17K |
9K |
15K |
-21K |
45K |
| Manufacturing |
7K |
0K |
15K |
1K |
2K |
| Service-Providing |
92K |
163K |
169K |
-127K |
135K |
| Retail Trade |
-1K |
24K |
10K |
0K |
13K |
| Financial |
-22K |
-6K |
-17K |
2K |
-39K |
| Business |
6K |
22K |
28K |
4K |
36K |
| Temporary help |
1K |
9K |
8K |
2K |
19K |
| Education/Health |
40K |
54K |
95K |
-49K |
119K |
| Leisure/Hospitality |
70K |
30K |
44K |
-31K |
5K |
| Government |
52K |
2K |
12K |
-8K |
-20K |
| Average Workweek |
34.3 |
34.3 |
34.2 |
34.3 |
34.3 |
| Production Workweek |
33.8 |
33.8 |
33.8 |
33.8 |
33.8 |
| Factory Overtime |
4.0 |
4.0 |
3.9 |
3.9 |
3.9 |
| Aggregate Hours Index |
0.1% |
0.4% |
-0.1% |
-0.2% |
0.4% |
| Avg Hourly Earnings |
0.3% |
0.2% |
0.2% |
0.3% |
0.4% |
| Household Survey |
|
|
|
|
|
| Household Survey |
|
|
|
|
|
| Civilian Unemp. Rate |
4.3% |
4.3% |
4.3% |
4.4% |
4.3% |
| Civilian Labor Force |
83K |
-92K |
-369K |
18K |
-1030K |
| Civilian Employed |
149K |
-226K |
-64K |
-185K |
-895K |
| Civilian Unemployed |
-66K |
134K |
-332K |
203K |
-135K |
|
|
|
|